Welcome to Blue Book!
Are you ready to join the thousands of companies who rely on Blue Book to drive smarter decisions? View our plans and get started today!
Still have questions? We’d love to show you what Blue Book can do for you. Drop us a line– we’ve been waiting for you.

In 2024, the domestic economy experienced notable highlights—inflation moderated, interest rates fell, a resilient labor market presided, and consumers were willing to spend.
However, challenges persisted: inflation was still too high, and bankruptcy rates jumped. Additionally, while consumer spending remained strong, many households faced financial pressure due to rising living costs. Overall, 2024 was a year of mixed economic outcomes, reflecting both progress and ongoing challenges.
As an information company, data is the foundation and core of Blue Book’s products and services. We share this data with our members either as events or in the aggregate, like our ratings, scores, and reports.
We also assemble data to get a read on industry performance, how it’s trending, and how it compares to the overall economy. Though not always reflective of big change, every year we take a deeper look and write about what our data is telling us.
We see some interesting trends when looking back at the data for 2024. In last year’s article, we asked two questions: 1) will company closures continue on a downward trajectory, and 2) will trading performance continue to trend positively? This article will answer these questions and more.
All data in this article may be inclusive of small fractional errors as a result of reporting and data compilation. Blue Book Services does not express an opinion on any of the data displayed, nor is it intended to suggest future events or outcomes.
A Glance at Industry Risk
The most effective way to share the overall health and state of the produce industry is through our credit scores, or the Blue Book score.
Blue Book scores were first introduced to the produce industry in 2006 and have offered members a means to assess trading risk quickly and confidently. Since their introduction, member reliance has grown exponentially as the scores have proven to be one of the most reliable trading risk tools offered to the industry.
Blue Book scores predict the likelihood of delinquency and/or default within the next 12 months. Scores range from 500 to 999, with 500 being high risk and 999 being low risk.
As it’s always been, interpreting scores and score behavior is reliant upon the underlying dynamic of trading performance. As a company performs well, its score will be higher, and it will be of lower risk. On the other hand, when a company is performing at an unsatisfactory level, its Blue Book score will be lower and reflective of greater risk.
The 2024 Year-End Score Distribution chart (below, left) reflects the produce industry’s overall scored population. Just 14.6 percent of the scored population is below 700, regarded as high or moderately high risk, while 66.9 percent of the scored population was 800 and higher, regarded as low risk. For a closer look at scoring year-over-year, compare 2024 with 2023 (below, right).
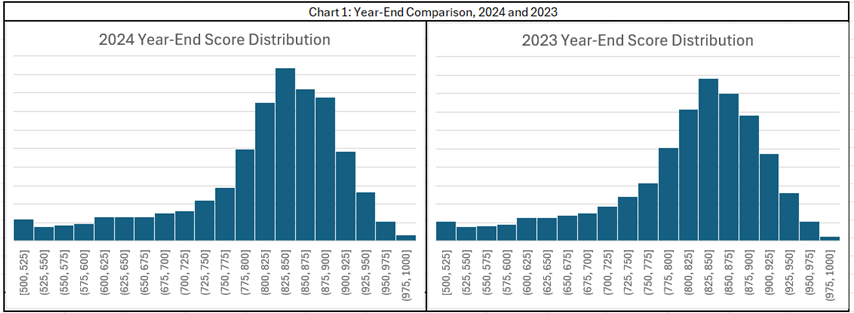
For 2023, 14.8 percent of the score distribution was below 700; two-tenths of a percentage point higher than 2024. Scores of 800 and greater were 64.8 percent of the scored population, almost a full point lower than 2024.
The scores in 2024 shift to the right (or improved), predominately in the 700 and 800 score buckets.
The proportional change for companies scored in the 700s in 2023 went from 20.3 percent to 18.5 percent in 2024, and 800s went from 50.1 percent in 2023 to 52 percent in 2024. Score distribution changes for 500s, 600s, and 900s were subtle.
What does this mean? Companies found to be of moderate or moderately low risk improved their risk profile as a result of improved trading performance. Further evidence in overall trading improvement is seen in the average Blue Book score: in 2024, the score average rose slightly to 809 from 807 a year earlier.
If you have questions about Blue Book scores or other details related to company risk profiles, please contact a Blue Book rating team associate.
Blue Book Ratings
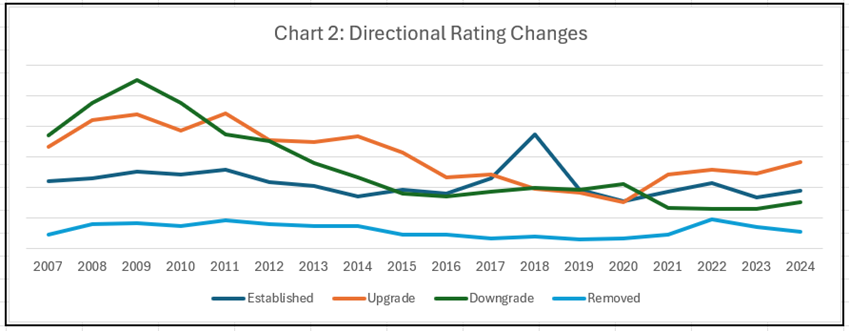
Data reflected in Chart 2 includes rating change directions, rating withdrawals, and newly established rating assignments. Rating changes are fluid and reported on companies that lack support for an assigned rating and can be an upgrade or downgrade.
Newly established ratings are the result of a sufficient number of trading partners sharing trade experiences, either via trade experience surveys, accounts receivable (A/R) aging files, or other influences such as a lawsuit or claim filed against a company.
Both upgrade, downgrade, and newly established rating trends increased in 2024, though upgrades were the change leader—consistent with increased scoring averages.
A lesser number of rating withdrawals were made in 2024, often the result of insufficient data to support a rating assignment, which could be a rating of either high or low risk. The 2024 withdrawals are realigning with pre-2020 values, when withdrawals started to tick up in 2021 and 2022.
Significant Business Events
Chart 3, Business Event Reporting, depicts business event trends since 2000 as researched and reported by Blue Book. Business event data includes closures, bankruptcies, mergers and acquisitions, and new entries into the produce industry.
The number of closures reported for 2024 continues to show a decline from the recent peak in 2019 and is at a low for the period covered. Business closure reporting was down 19.5 percent year-over-year.
Bankruptcy reporting remained low over 2023 and within normal reporting limits, relative to the last 20 years. Total petition numbers also were small in 2024, but proportionally, industry bankruptcy, which includes transportation service providers, increased 22 percent.
For reference, according to UScourts.gov, Chapter 7 bankruptcy business filings (in all sectors) for the 12-month period ending December 31, 2024 were 12,583 compared to 10,229 for the same period in 2023, while Chapter 11 filings were 8,456 in 2024 compared to 7,070 in 2023.
Total and all business filing types in 2024 were 23,107, compared to 18,926, an increase of 22 percent year-over-year—the same increase Blue Book reported.
According to a January 2, 2025 Reuters article, “Rising interest rates, inflation, higher labor costs, and post-pandemic shifts in consumer spending were common factors cited by companies that filed for bankruptcy in 2024.”
Bankruptcies in the produce industry, including those that serve produce, have been on the rise yet remain relatively low compared to prior periods.
In the same Reuters article, bankruptcy experts expect these factors to continue to drive companies over the brink in 2025. Several particularly hard-hit industries struggling in 2024 “will continue to experience financial distress and restructuring activity in 2025, including healthcare, automotive, casual dining, and retail.”
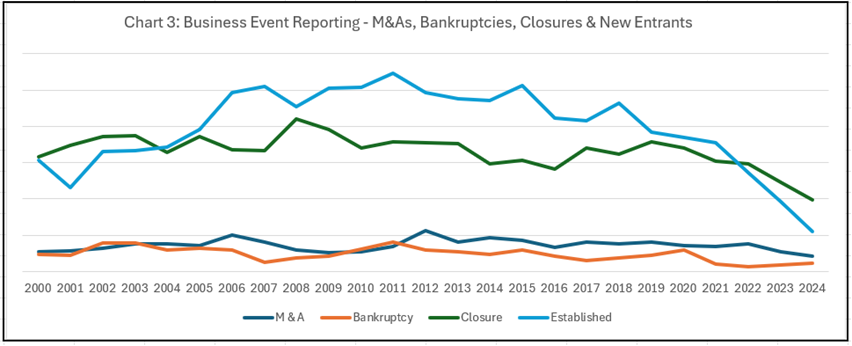
New entrants, or companies coming into the produce marketplace and being listed by Blue Book, have been in decline since 2015. And, for the last couple of years, they have been outpaced by closures.
Conversely, according to U.S. Census Bureau statistics, 5.2 million new business applications were filed in 2024 compared to 5.5 million in 2023. Business applications on the whole remain high relative to 20-year norms, ranging from 2.5 million to 3.5 million.
Produce-themed mergers and acquisitions (M&A) have been declining since 2012, with 2024 hitting another 20-year low, even though 2024 had plenty of notable M&A transactions.
According to insights offered on January 16, 2025 by ksmcpa.com, citing Pitchbook data, “U.S. mergers and acquisitions increased both in deal volume and value by 13 and 19 percent respectively.” The article further notes, “Stabilizing interest rates, sector-specific growth opportunities, and renewed corporate confidences are creating a fertile environment for dealmaking in 2025.”
Though produce M&A activity was down in 2024, optimism in general seems to be in the air for 2025. What’s clear is the industry—and outside buyers—seeking growth can find it in the produce industry. So 2025 is shaping up to be an active and exciting year.
Concluding Thoughts
All in all, our metrics would suggest the produce industry remains strong. Trading risk and performance shows improvement and closures remain below industry norms.
Leading into 2024, domestic inflationary pressures and high interest rates were top of mind. And while some easing has taken place, these challenges continue to persist through the first quarter of 2025. Other challenges have emerged, including tariffs—will these matters settle or plague the domestic and global economy throughout the year and beyond?
Economic predictions for 2025 are mixed and uncertain; many seem to think gross domestic product will slow, inflation will remain higher than what is desired, interest rates will likely ease, and while the labor market appears to be decent, some have raised concerns there too.
Will 2025 produce industry performance continue positively? Will closures stay low and can the bankruptcy rate taper off? Will new entrants continue to slope downward, and will investors and growth seekers pick up the pace in 2025?
We’ll know in nine short, fast months. My guess is the produce industry will find its way through these volatile times—it always does, and maybe we’ll see a few surprises along the way.
Regardless of the headwinds, history shows most well-managed and adequately capitalized produce businesses survive and often thrive as they move forward, creating greater growth opportunities through innovation, ingenuity, and getting the best out of their people.


